DATA ON DANCE ORGANIZATIONS, GROUPS & PROJECTS
Page Updated July 27th, 2021 2:00 p.m.
RESPONDENTS AT A GLANCE
- Survey data is the second phase of a follow-up to the Spring 2020 survey launched at the outset of the pandemic.
- 259 valid survey responses from dance organizations, groups and projects between March 2020 and May 2021.
- Budgets range from $1,000 to $7.8M
- Groups principally identify as dance companies (72%), with a few identifying primarily as dance education providers (7%), dance presenters (5%) and service organizations (9%)
TOP KEY TAKEAWAYS (As of July 20, 2021)
Some critical needs have not been met and remained priorities throughout the pandemic. These include:
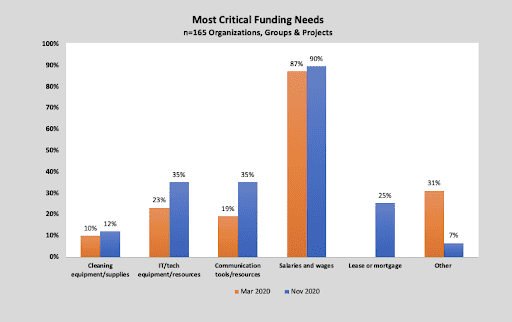
- Salaries and wages (87%.)
- Lease/mortgage payments (26%)
Prioritization of other needs is decreasing over time:
- IT/tech equipment and resources to support digital operations (decrease from 35% in Fall 2020 to 28% in Spring 2021)
- Communication tools and resources (decrease from 35% in Fall 2020 to 23% in Spring 2021)
For most, losses are not covered by insurance. Only 9%* filed insurance claims. While 38%* did not have insurance that would cover pandemic-related losses, 43% did not even have the capacity to file claims. However, 56% applied for federal funding either through the Paycheck Protection Program or Economic Injury Disaster Loan program. Of those that applied. 87% received funding.
*These figures come from the Fall 2020, survey pool of 200 organizations, groups and projects, which includes more comprehensive results.
MOST CRITICIAL FUNDING NEEDS
Decreasing needs for IT/tech and communication resources may be related to decreasing reliance on digital operations and program and increased focus on live/in-person programming as pandemic restrictions loosen.
In Spring 2021, 71% of organizations, groups and projects are engaging or planning to engage in live programming. Nearly half (45%) are planning to engage in outdoor performances and indoor rehearsals, one-third (33%) in indoor classes and one-quarter (24-26%) in indoor performances, outdoor classes and outdoor rehearsals.
Most organizations (87%) have offered digital programming since March, this was new for nearly all (91%) of the groups that offered it. These efforts will shape the future of dance programming, as at least 41% will continue to offer digital programs post-pandemic and 56% are considering it.

FINANCIAL IMPACT (As of July 20, 2021)
Dance organizations, groups and project budgets contracted by nearly over one-quarter (28% avg) during the pandemic due to earned and contributed revenue losses.
The smallest organizations are most impacted, with budgets contracting by nearly half (48% avg).
Dance entities have continually adjusted their financial picture and projections as the pandemic has gone on. For example, while 31% of respondents reported budgets less than $50K pre-pandemic, 43% were in this budget category mid pandemic.
Change in Budget Size Distribution
Notably, contributed income losses were not as significant as many thought in Spring 2020. While income raised from individuals and corporations declined by anywhere from 2 to 7%, many organizations were able to access increased foundation and government grants.
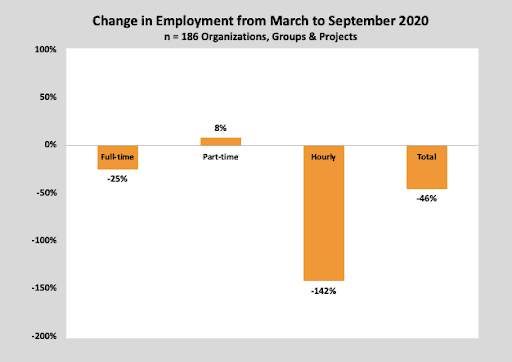
For many organizations, groups and projects, reduced human resources were necessary to reduce operating costs in the midst of the pandemic. At least 1,500 employees have been impacted; just under half (47%) were furloughed.
Change in Employment
Increasing proportions of organizations, groups and projects are more optimistic about their ability to survive the pandemic. Nearly three-quarters (71%) of Spring 2021 believe their likelihood of permanent closure is unlikely or extremely unlikely as compared to 53% of Fall 2020 survey respondents. Even still, 8% of organizations, groups or projects think permanent closure is likely and 23% are neutral on the topic.
Likelihood of Permanent Closure
More than half of responding organizations, groups and projects are optimistic about their ability to survive the pandemic. Just over half (53%) believe their likelihood of permanent closure is unlikely or extremely unlikely. That means that nearly half of the field is not certain about the future of their organization, group or project.

NOTABLE IMPACTS BY BUDGET SIZE
Segmentation analysis reveals that different types of organizations, groups and projects are impacted differently by the crisis.
Generally, the bigger the budget, the larger the projected earned revenue loss. While the smallest organizations, groups and projects (with budgets less than or equal to $25K) report an average loss in earned revenue of $15,864, the largest budget survey respondent projects a loss of over $4.6M. However, smaller organizations are likely to sustain more significant impacts, as these losses represent nearly half of these groups’ total operating budgets.
Facility operators are projecting the highest average earned revenue loss ($107,552 avg vs $63,551 total avg.) Dance companies are projecting average earned revenue losses higher than other types of groups, including dance presenters, educators, service organizations and other entities.
To date, small budget organizations, groups and projects (with budgets less than $100K) have been less likely to experience cash flow issues and more are unsure of whether they will. Of groups with budgets less than $100K, 63% experienced cash flow issues as compared to 71% of the total respondent pool.
More service organizations express need for IT/Tech equipment needs and resources. And more organizations in the Bronx (31%) have need for cleaning equipment/supplies than the total respondent pool (10%.) This finding mirrors the individual dance workers survey results, which showed more dance workers in the Bronx were also in need of cleaning supplies.
RESPONDENT POOL: ORGANIZATIONAL INFORMATION
This map shows the distribution of survey respondents by zip code, highlighting a strong response from organizations, groups and projects centered in Manhattan and Brooklyn. Dance/NYC continues community organizing efforts to generate input from more dance entities in the Bronx, Queens and Staten Island as well as parts of New Jersey, Long Island and Westchester County.


Log in to comment